How PyVRP cuts waste collection driving by more than 40%
We used PyVRP to solve Groningen's daily waste collection problem. In a simulation environment using real municipal data, the policy reduces daily driving by more than 40% while maintaining service levels.
251 km → 146 km
6.8 h → 3.8 h
Maintained, same as today
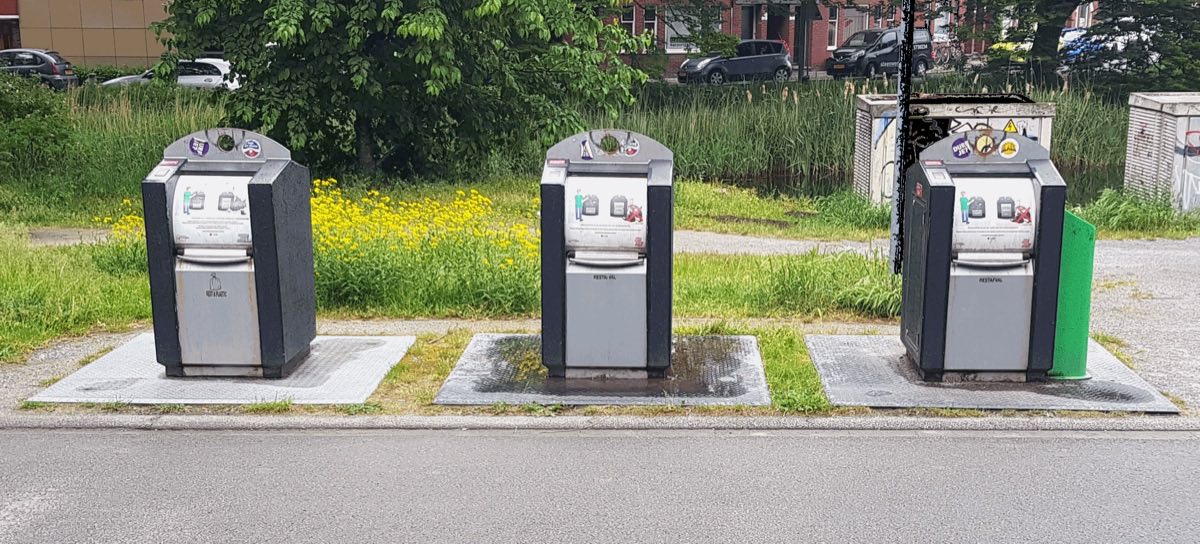
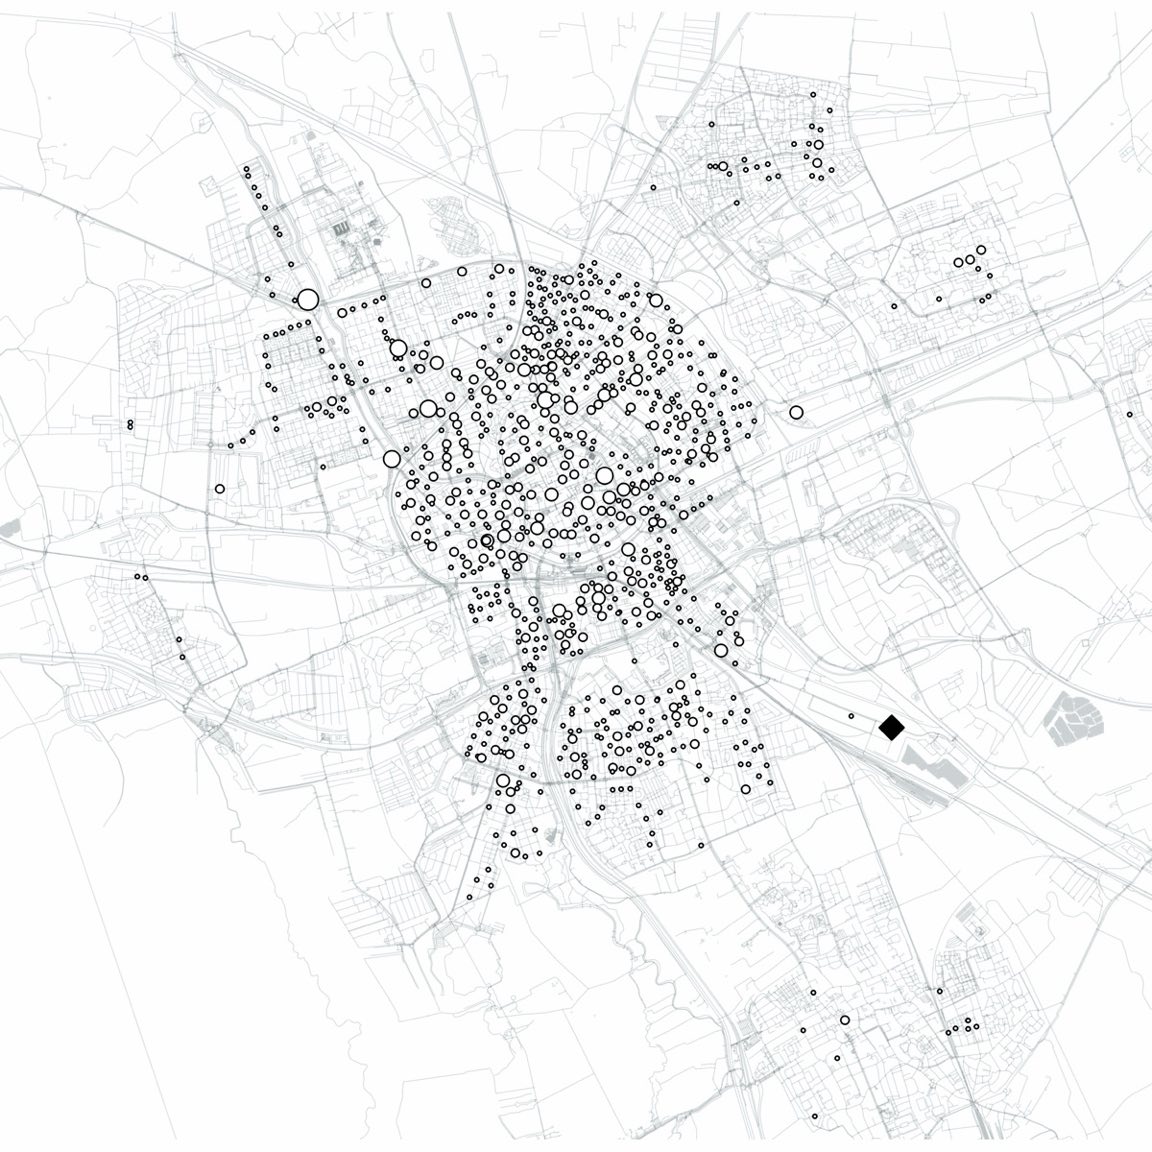
A daily urban waste collection problem in Groningen.
Groningen is a city of about 240,000 residents in the north of the Netherlands. Most residents bring their waste to local underground containers organised in 850 clusters of 1,120 individual containers, spread across the city. Residents open a container with an access card, and every deposit is registered in real time. The volume and weight of each deposit are not measured.
Four collection vehicles run daily shifts from a single depot to empty container clusters.
Minimise collection cost, but prevent overflows.
Every morning the municipality plans routes for collection vehicles to empty a subset of the container clusters. Those routes should be as short as possible, but long enough to visit the clusters likely to overflow.
Emptying a cluster too late causes overflows: residents leave bags next to full containers, and cleaning those up takes a separate vehicle. Emptying too early wastes truck time on half-full clusters.
The current baseline policy decomposes the daily shift plan into two steps: first select the 250 clusters expected to fill up soonest, then route those selected clusters. This reaches a 99.9% service level, but at high cost: clusters are on average only 48.9% full when emptied, and the travel distance amounts to 251.2 km per day, and take 6.8 hours per route.
The hard part is that selection and routing interact, and should not be decomposed. A half-full cluster right on the route is nearly free to empty today, and emptying it today might avoid a dedicated trip later in the week. A policy that decomposes cluster selection before routing cannot weigh that trade-off.
Selection and routing in one integrated model.
We designed an integrated selection and routing policy, which makes both decisions in a single optimisation. It first estimates a prize for each cluster: a value expressing the urgency of emptying it before the next planning moment.
Those prizes are then used in a prize-collecting vehicle routing problem with time windows and driver breaks. The solver decides which clusters to service and in what order, while minimising routing costs and uncollected prizes.
We solve the routing problem with PyVRP, our open-source routing solver, inside a realistic simulation environment. PyVRP models the optional visits, time windows, and driver breaks directly, and solves each daily problem over 850 clusters in under a minute, well within the municipality's morning planning window.
Same service level, more than 40% less driving.
We compared the policies in a simulation based on the municipality's own data: nearly two million registered deposits from Q1 2023, with truck distances and durations estimated from OpenStreetMap. Results are averaged over ten one-year simulation runs after warm-up.
| KPI | Current | Integrated | Change |
|---|---|---|---|
Daily driving distance | 251.2 km | 146.4 km | -41% |
Route duration including breaks | 6.8 h | 3.8 h | -44% |
Service level services before the cluster overflows | 99.9% | 99.9% | unchanged |
Clusters serviced per day | 250 | 153 | -39% |
Cluster fill level at service higher is better utilisation | 48.9% | 79.9% | +31 pts |
Average overflow volume when an overflow does occur | 1,537 L | 93 L | -94% |
Default baseline policy with 250 clusters per day; integrated policy at its highest service setting. Averages over ten simulation runs. Full details are in the paper and code.
While maintaining the same high service level, the integrated policy reduces average daily driving distance by 41%, from 251.2 km to 146.4 km. Route duration falls by 44%, from 6.8 hours to 3.8 hours.
The integrated policy services about 100 fewer clusters per day, but the right ones. Average fill level at service rises from 48.9% to 79.9%, which implies far greater use of the available container capacity. At the same time, when a rare overflow does happen, the average overflow volume falls from 1,537 litres to just 93 litres, or about two reasonably filled bin bags.
Data-driven route optimisation.
This case shows the strength of data-driven planning in real operations. Groningen's deposit counts alone were enough: by integrating selection and routing into one algorithm, our policy visits clusters when it matters most, reducing driving by more than 40% while maintaining the city's high service level.
The approach carries over to other municipalities with similar container systems. It works with deposit counts, and it works even better with fill sensors, which make the overflow estimates more accurate. More broadly, the same algorithmic idea applies to any operation that dynamically decides which tasks to do and how to route them, such as same-day delivery and field services.
Solve your routing problem.
RoutingLab builds route optimisation solutions around your operations and constraints. Get in touch to discuss your routing problem.